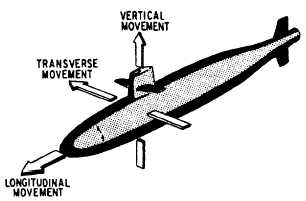
Figure 4-22.-Submarine's magnetic moment.
magnetic strength. In views C and D, the submarine’s
magnetic field distorts the natural field as shown. The
density of the natural field is decreased in view C and
increased in view D. The natural angle of dip is also
affected, but only very slightly.
Submarine Anomaly
The maximum range at which a submarine may
be detected is a function of both the intensity of its
magnetic anomaly and the sensitivity of the detector.
A submarine’s magnetic moment (magnetic
intensity) (fig. 4-22) determines the intensity of the
anomaly. It is dependent mainly on the submarine’s
alignment in the earth’s field, its size, the latitude at
which it is detected, and the degree of its permanent
magnetization.
MAD equipment, in proper operating condition, is
very sensitive; but the submarine’s anomaly, even at a
short distance, is normally very weak. The strength of a
complex magnetic field (such as that associated with a
submarine) varies as the inverse cube of the distance
from the field's source. If the detectable strength of a
field source has a given value at a given distance and the
distance is doubled, the detectable strength of the source
at the increased distance will then be one-eighth of its
former value. Therefore, at least two facts should be
clear. First, MAD equipment must be operated at a very
low altitude to gain the greatest proximity possible to
the enemy submarines. Second, the searching aircraft
should fly at a predetermined speed and follow an
estimated search pattern. This ensures systematic and
thorough searching of the prescribed area so that no
existing anomalies are missed.
Anomaly Strength
Up to this point, the inferred strength of a
submarine’s anomaly has been exaggerated for
purposes of explanation. Its actual value is usually so
small that MAD equipment must be capable of
detecting a distortion of approximately one part in
60,000. This fact is made apparent by pointing out
that the direction of alignment of the earth’s magnetic
lines of force is rarely changed more than one-half of
1 degree in a submarine anomaly.
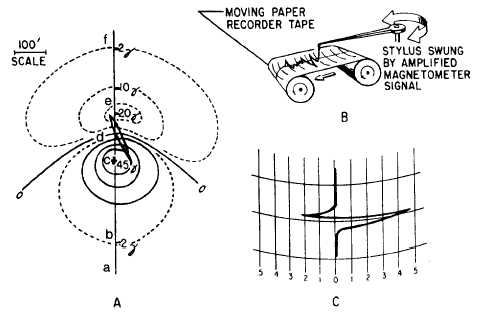
Figure 4-23, view A, represents a contour map
showing the degree of anomaly caused by a
submarine. The straight line is approximately 800
Figure 4-23.-A. Degree of anomaly. B. Anomaly stylus. C. Sample anomaly record.
4-17