CHART SOUNDING MARKS
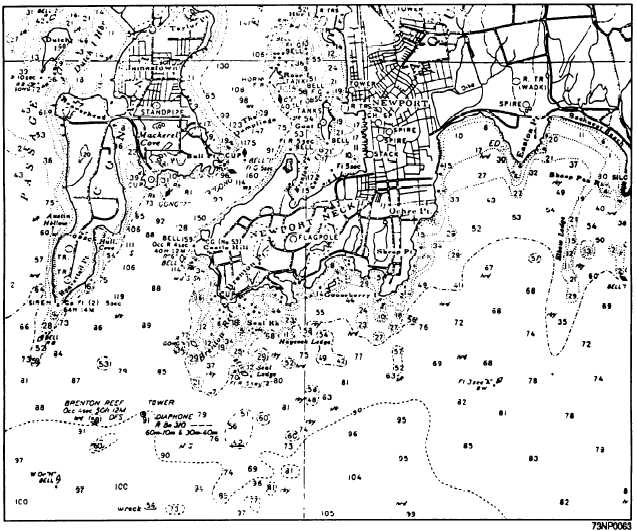
Scattered over the water area of each navigational
chart are many tiny figures, as in figure 9-7. Each
figure represents the depth of water in that locality.
Depths on charts are shown in feet, fathoms, or meters.
A notation under the title of the chart provides the key
to its depth; for example, “Sounding in feet at mean
low water,” or “Sounding in fathoms at . . . .” Most
charts also contain broken lines called fathom curves,
marking the limits of areas of certain depths. A
10-fathom (60-foot) curve and a 15-fathom (90-foot)
curve can be seen in figure 9-7.
CHART ISSUE
Charts used in the Navy may be prepared by the
Defense Mapping Agency Hydrographic/
Topographic Center (DMAHTC), the National Ocean
Service (NOS), the British Admiralty, or other
hydrographic agencies. Whatever the source, all
charts used by the Navy are issued by the Defence
Mapping Agency (DMA).
The Defense Mapping Agency (DMA) Catalog of
Maps, Charts, and Related Products is a four-part
catalog published by the Defense Mapping Agency
Office of Distribution Services (DMAODS). It
provides a comprehensive reference of all DMA maps,
charts, and related products that are available for
information.
NOTICES TO MARINERS
The chart and publication correction system is
based on the periodical Notices to Mariners, published
weekly by the DMAHTC to inform mariners of
corrections to nautical charts and publications. This
Figure 9-7.—Navigational chart showing depths and fathom curves.
9-6


